15dot4-sniffer Java Application
Files
Usage Instructions
To use the app, simply hit “Connect”. Immediately the status line should become valid. Over the next few seconds the “Mode” should become valid, followed by the “Operating Channel”. This means the device connected correctly:
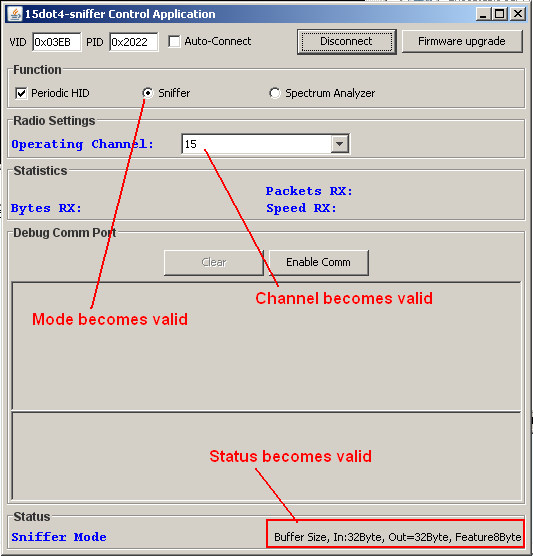
When you receive a packet, the “Packet RX” will increment. Note that “Bytes RX” and “Speed RX” is currently not implemented, and will never have valid data!
If your capture hardware uses an RF231 or RF212, the RSSI will be displayed as well. The RSSI shows the value for the last received packet:

You can set the channel by selecting a new one with the drop-down menu. The channel becomes valid almost instantly after selecting a new channel.
Spectrum Analyzer Mode
Spectrum analyzer mode provides a graphical interface to the Energy Detect (ED) engine in the RF230/RF231/RF212 devices. This allows using the USB stick as a simple spectrum analyzer. To use simply select the ‘Spectrum Analyzer’ radio button, and the SA window opens. The window looks like this:
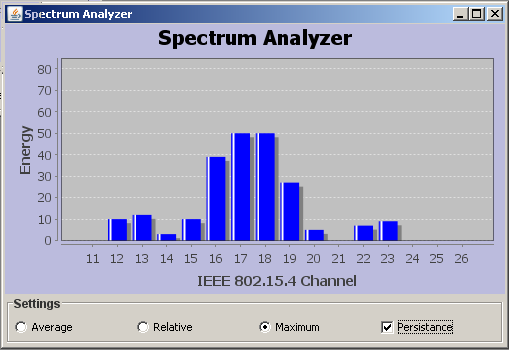
The spectrum analyzer works by scanning all channels in the operating band of the hardware. For the RF230/231 that scans 802.15.4 channels 11 - 26, for the RF212 it scans channels 1 - 10.
On each channel 100 Energy Detect (ED) scans are taken (ie: takes 14mS per channel on the 2.4 GHz band) before moving to the next channel. Once all channels have been scanned, the data is sent to the host, and the process restarts at the lowest channel. The three display modes (Average, Relative, Maximum) change how the data is processed.
- Average means that the energy in a channel is calculated by adding up the sum of all 100 scans, then dividing by the number of scans.
- Maximum means the energy in a channel is calculated by taking the highest reading of all 100 scans on that channel.
- Relative provides a measurement of energy relative to other channels. This mode was for testing and should not be used, as it does not provide any useful information currently.
To find networks, typically ‘Maximum’ is the most useful. It will capture quick high-energy transmissions, such as a packet being transmitted from a node to another node. To find channel energy ‘Average’ is more useful.
The ‘Persistence’ checkbox means the display keeps the highest value in any channel on-screen. This is useful for building up a picture over many scans of the radio environment.
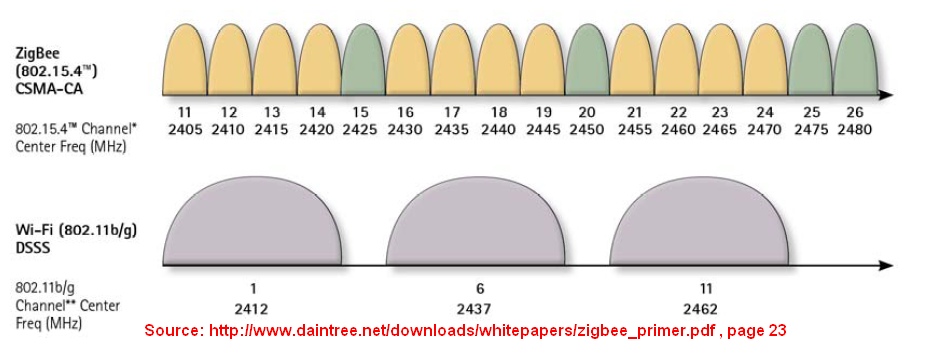
Ref: 802.15.4 & 802.11 Frequency Channels
The previous picture of the spectrum analyzer in use shows channels 16/17/18/19 with considerable energy. This is caused by an 802.11g access point being several feet from the spectrum analyzer, operating on channel 6.
A paper by Daintree demonstrates the overlap between 802.11 (USA-band) channels and 802.15.4 channels:
http://www.daintree.net/downloads/whitepapers/zigbee_primer.pdf
Known Issues
- SA mode needs improvements to function more like an actual spectrum analyzer
- Switching from SA mode back to sniffer mode requires user to select operating channel, and allows them to select invalid channels (ie: channels 1-10 when hardware is 2.4 GHz, 11-26 when hardware is 900 MHz)
- Debug Comm Port only works with RavneUSB